10 Things I Love About SNA
As a passionate Kat Stratford supporter, the obvious choice for my first big social network analysis project was analyzing her story: 10 Things I Hate About You. This project comes from my sociology seminar on social network analysis, which was my first experience with the programming language R and its interface RStudio. Much of the project focused on the movie characters’ centrality scores, which highlights how central a character and their connections are within this plot. On top of this, I also included a comparative analysis between the movie and it’s inspiration: Shakespeare’s play The Taming of the Shrew. I conducted Girvan-Newman cluster comparison across the pieces of media to learn more about how groups of people interacted within each story. These stories both address gender stereotypes and relations, so I also found it important to investigate gender homophily, which refers to how much characters of the same gender only are connected to each other.
Centrality Scores
In social network analysis, centrality is a valuable calculation that attempts to capture how connected a person (or node) is to others in their network. There are multiple ways to calculate centrality which all emphasis different characteristics of what it means to be “central” in a network. In my analysis, I found it interesting to calculate the centrality for all movie characters via 4 different methods and compare the differences in scores to better understand each character’s connections.
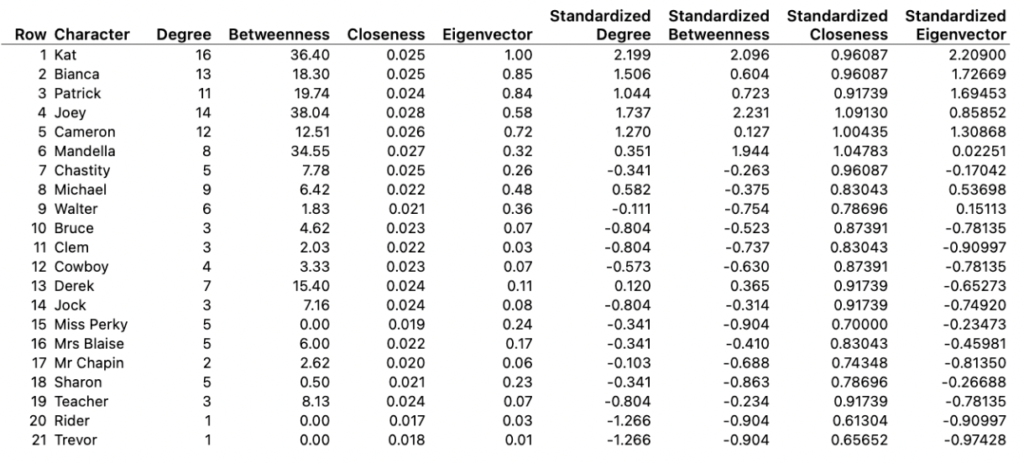
Degree Centrality: a simple count of how many connections (edges) a character has to other characters
Betweenness Centrality: higher emphasis placed on characters that act as “bridges”that connect a lot of characters to others, they are especially essential to the flow of information in networks as they connect otherwise unconnected nodes
Closeness Centrality: a measure of the geodesic (shortest possible) path from that character to all other characters
Eigenvector Centrality: focused on how well connected a character’s connections are, simply put it measures popularity
The first 4 columns are raw calculations, meaning those numbers are the unedited result of the centrality calculations. The next 4 columns are standardized versions of those numbers. Within each of those columns, all of the characters’ scores are taken into account to determine an average. This average is set to 1, if a character’s score is above 1 they have a higher score than the average, if it’s below 1 their score is below average.
When looking at the sisters Kat and Bianca, they both score high on most measures of centrality. An interesting difference shows up in betweenness centrality, though. Kat scores high in this category, while Bianca is below average. Betweenness measures how much a character connects to other characters and because Kat connects the popularity kids to her own friend group, she acts as a bridge in this network. Bianca scores low in this category because she only interacts with people in her own group of the popularity kids.
In the graph on the left, each character is represented by a dot and the size of that dot is determined by the betweenness centrality score. The positions of the dots also reveal a character’s centrality as dots that are further out from the center are less connected. In the middle is Kat, with Bianca’s smaller dot to her left.
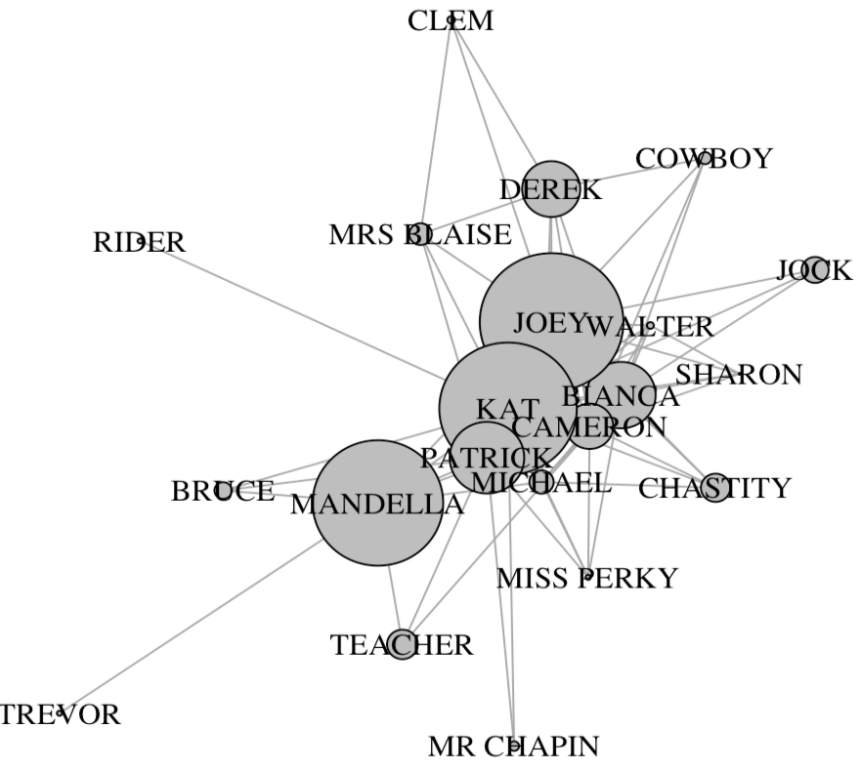
10 Things I Hate About You Betweenness Centrality
Clustering
Clustering is another interesting calculation in SNA which involves grouping together nodes that are connected. In this project, I used the Girvan-Newman clustering method which uses betweenness centrality to repeatedly eliminate connections between nodes that aren’t significant until you’re left with distinct groupings.
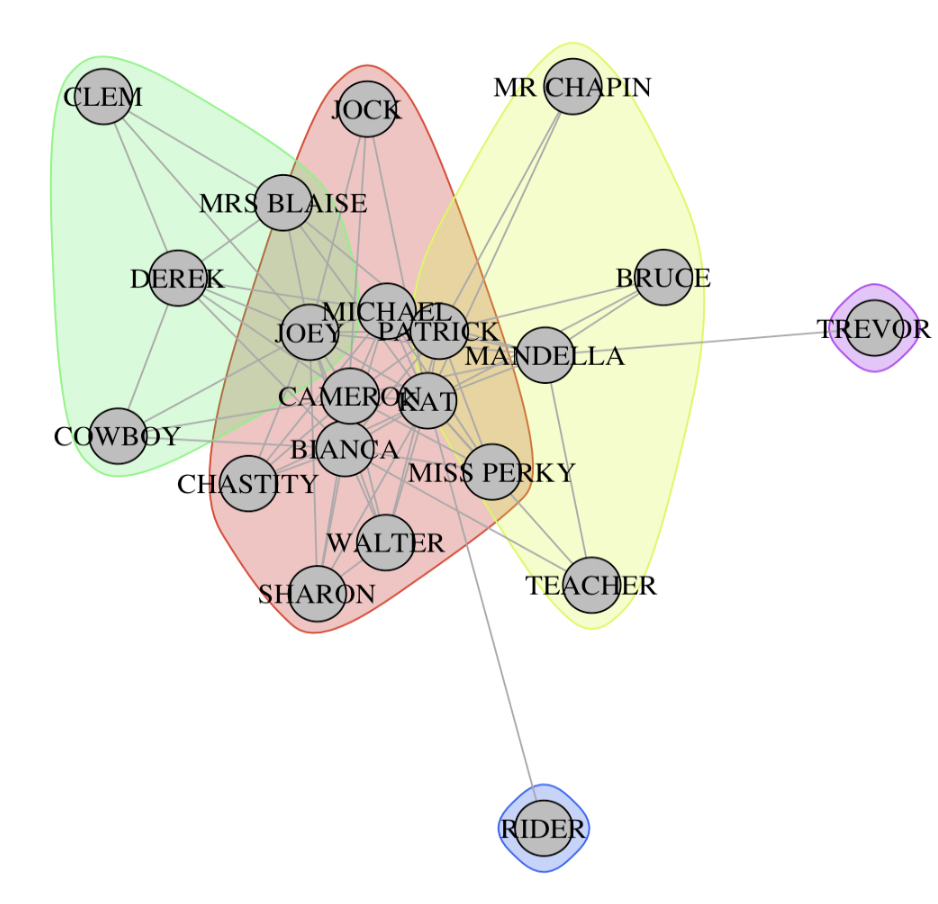
10 Things I Hate About You Clustering
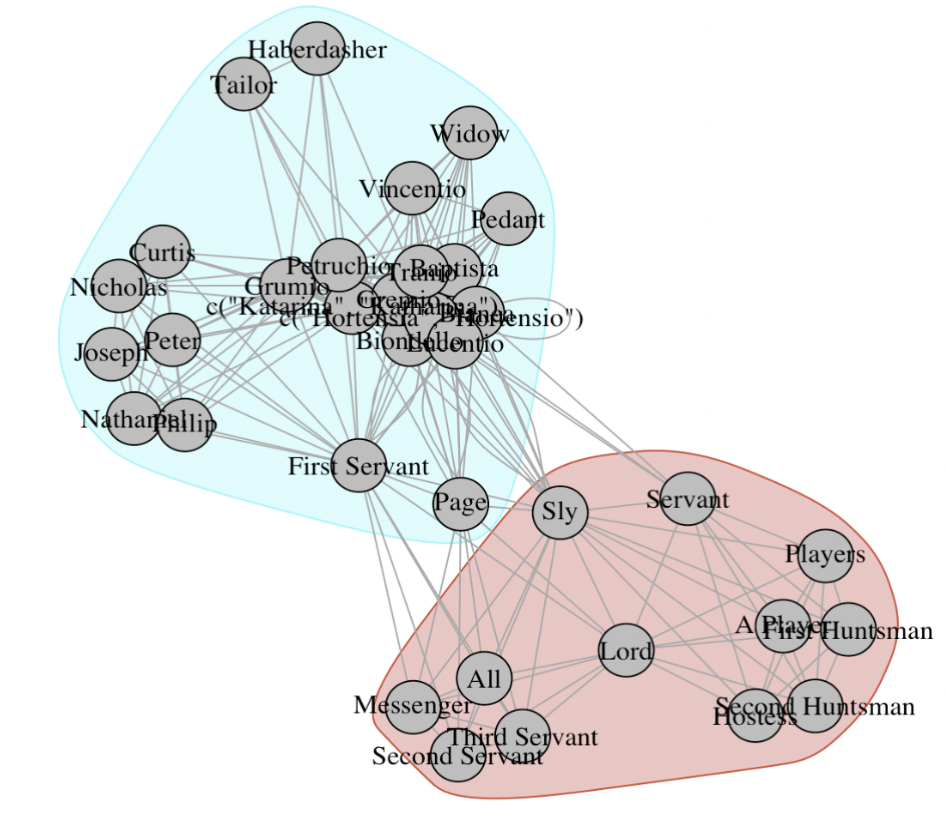
The Taming of the Shrew Clustering
The clustering of the movie and play are strikingly different. The movie network contains 3 clusters of substance, excluding the 2 clusters that are just one person, that each have same overlap where characters are in multiple clusters. The main characters are all in the center red cluster, though. The play network has only 2 clusters in which all of the main characters are in the top blue cluster while the lower red one consists of unnamed side characters.
The Paper!
If you’d like to learn more about this project, I’ve included my final research paper below. It has deeper analysis of the topics mentioned here and includes more fun graphs.